
Iconiq Growth recently published their annual Topline Growth & Operational Efficiency report on scaling B2B SaaS companies, which is very interesting and informative but also happens to be 54 slides long. What follows are the most interesting tidbits I gleaned from reading through.
Gross and Net Retention for Top Quartile SaaS Co’s
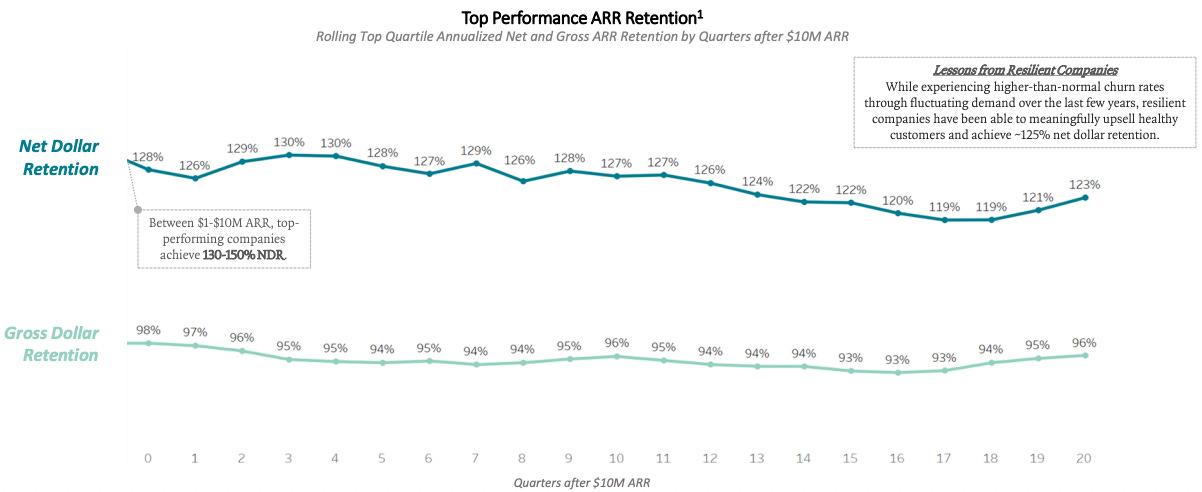
I liked this chart very much. Information abounds on what top performance looks like for Net Revenue/Dollar Retention, but less often discussed is its undervalued sibling, gross dollar retention.
I frequently come across growth-stage companies with pretty robust net expansion covering up relatively high churn, leading to sterling-looking NRR despite a very leaky bucket. This data shows that top-quartile SaaS performance looks like great net dollar retention resting on a foundation of very high gross/logo retention. Net retention above 120% and gross retention above 92% is the standard.
Typical ARR Growth Beyond $10m

This is the platonic growth curve past the $10m ARR point. It goes $10m —> ~$25m —> ~$55m —> ~$100m —> ~$155m over a 4-year period.
One thing to notice is the smoothness of the Net New ARR bars on the very bottom; investors evaluating a SaaS business will not only look at the rate of overall ARR increases, but the pace at which new ARR is being acquired in each quarter (and what the cost/burn was in the same period). The pace of Net New ARR acquisition is more in the business’s control than the overall ARR number, because that number is fully reflective of what you accomplished in the quarter, which is often a function of the size of your go-to-market team. So you’ll notice that although from quarter 0 to quarter 4 the business’s overall ARR went up by 160% ($10m to $26m), net new ARR in the period only went up by 60-70% ($3m to $5m). This is the power of the SaaS business model: operating leverage coming from the ability to grow revenue at a significantly faster rate than the size of your team (once you get to the scaling stage).
Speaking of operating leverage…
ARR per FTE

ARR per FTE is the most important efficiency metric that any of my partner companies spend their time thinking about. Not necessarily to benchmark against other businesses (although that’s important), but for the company to benchmark against itself. The most important thing about this metric is that, past $10m or so in ARR, in all scenarios except when the company is investing heavily in growth and expansion, the ARR per FTE number should be going up quarter after quarter. As the number goes up, the business achieves greater operational leverage and de-risks significantly.
Anecdotally, I’ve noticed that once scaling SaaS companies get ARR per FTE over the $130k mark, they begin to feel a lot more in control of their own destiny & start having a lot more fun.
The Burn Multiple
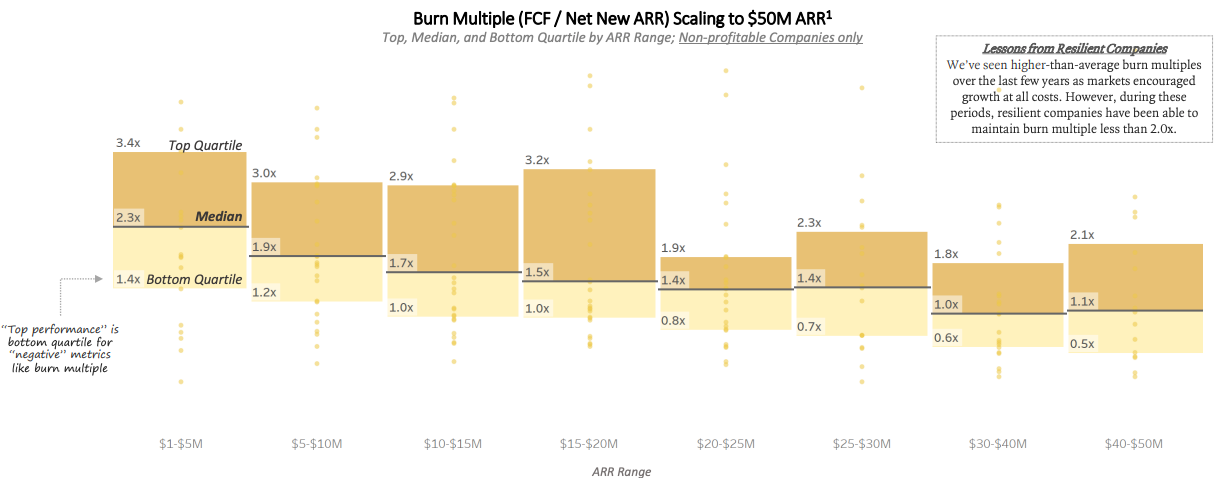
Behold the “Burn Multiple”, a metric that popped into David Sack’s head one random Thursday morning in The Early Pandemic and which is now the staple of every venture associate’s “How to Survive in a Downturn” manifesto (“you gotta bring down that burn multiple, bro”). Nobody has any idea how to manage or benchmark their burn multiple, all they know is that theirs is too high.
Seriously, though — the burn multiple is a fine thing to track (and certainly something that you want to see going down over time as you scale, as ARR per FTE goes up) but it doesn’t tell you a whole lot about whether a company is investing appropriately in order to generate long term returns. A company can be burning very little (relative to growth) yet not spending very effectively at all, or a company can be burning a ton on things that are very high ROI over the long run. Evaluating a company’s burn multiple is not a replacement for understanding the company’s unit economics.
Repeat after me…

If you enjoyed this brief summary, I highly recommend moseying over to the Iconiq Growth website to read the full report yourself.
Love this! Would love to see the same stuff but for earlier stage startups as well.